matplotlib感觉和matlab很像
任务9: 柱状图
1.运用pandas绘制
首先引入matplotlib这个包下面的pyplot模块
import pandas as pd
import matplotlib.pyplot as plt
在DataFrane下面绘制棒图
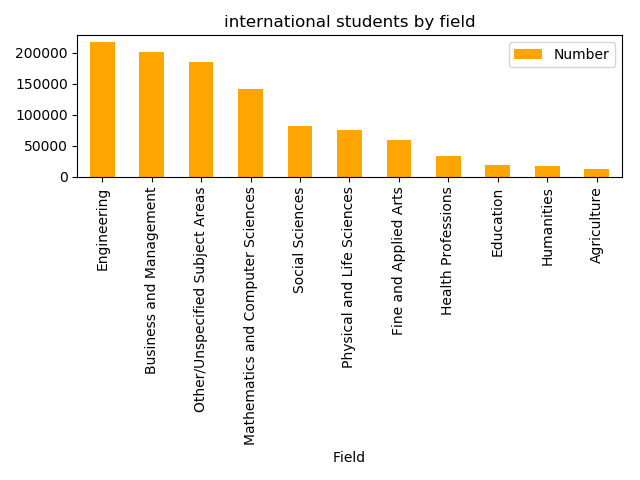
students.plot.bar(x='Field', y='Number',color='orange',title='international students by field')
plt.tight_layout()
plt.show()
输出结果

2. 运用matplotlib绘制
plt.bar(students.Field,students.Number,color='orange')
plt.xticks(students.Field, rotation='90')
plt.xlabel('Field')
plt.ylabel('Number')
plt.title('international students by field', fontsize= 16)
plt.tight_layout()
plt.show()
可以看出matplotlib比pandas绘图更加方便一些

